Graph based recommendation engine for Amazon products
During my Masters degree, my colleague and I worked on this cool project for big data class. We found a recently released dataset with Amazon products and reviews so we decided to build a recommendation engine based on these products. We initially looked at the collaborative filtering paper that was the basis of multiple giant companies’ recommendation engine like Amazon and Netflix. However, we decided to take another approach by representing the products in a big graph and capturing the product interactions in the edges of the graph. In this post, I will describe the data that we used, how we built the graph, how we evaluated our system and the different cases where our engine fails and how to potentially improve it.
The data
We used two datasets for this project. You can download them from here. The fist dataset contains customer reviews of products sold on Amazon from May 1996 to July 2014. Each review has a text description of the user experience, a rating of the product in question and a helpfulness vote which represents how helpful this review was to other customers. The raw data has 142.8 million reviews, however, we used a subset of this data such that each product has at least 5 reviews. Our subset data has 41.13 million reviews.
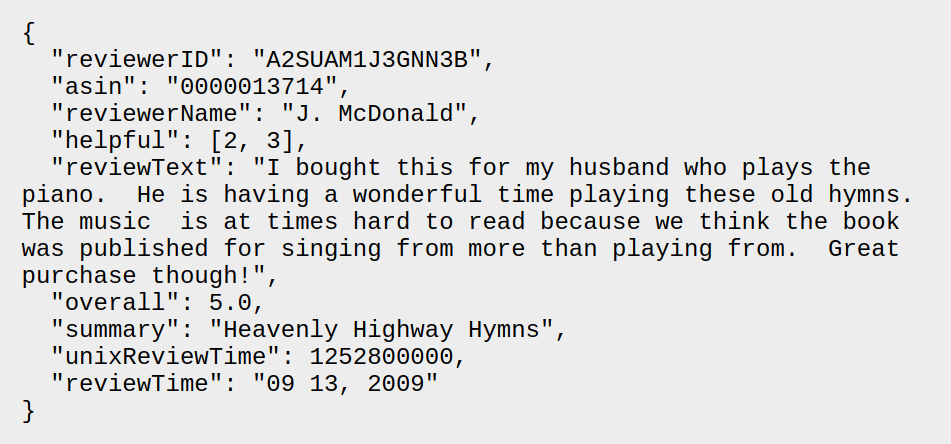
Product review sample
- reviewerID - ID of the reviewer, e.g. A2SUAM1J3GNN3B
- asin - ID of the product, e.g. 0000013714
- reviewerName - name of the reviewer
- helpful - helpfulness rating of the review, e.g. 2/3
- reviewText - text of the review
- overall - rating of the product
- summary - summary of the review
- unixReviewTime - time of the review (unix time)
- reviewTime - time of the review (raw)
The second dataset is product metadata. It includes product description, price, sales-rank, brand info and co-purchasing links. The co-purchasing links are split as follow:
- also_viewed: other products that customers viewed after viewing this product
- also_bought: other products that customers bought after purchasing this product
- bought_together: other products that customers bought together (package deal) with the target product.
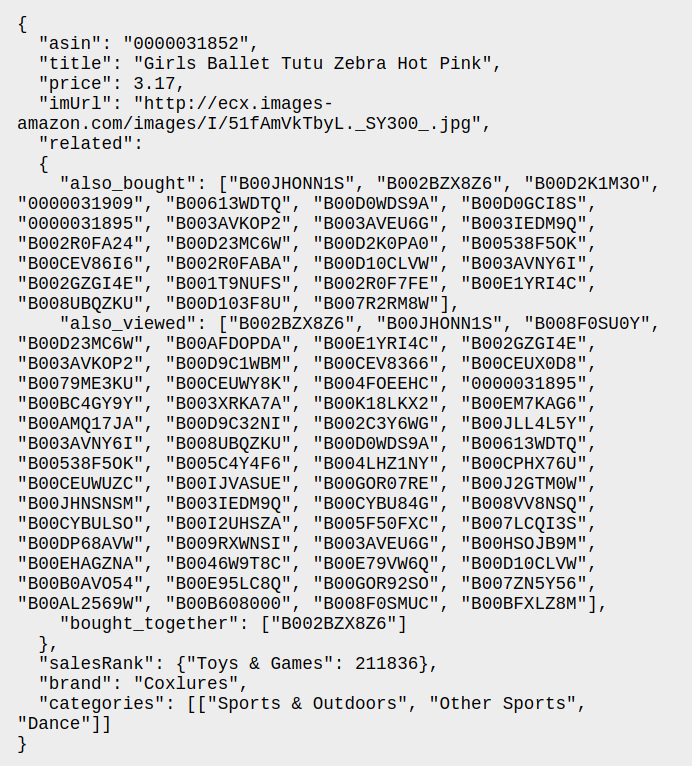
Product metadata sample
- asin - ID of the product, e.g. 0000031852
- title - name of the product
- price - price in US dollars (at time of crawl)
- imUrl - url of the product image
- related - related products (also bought, also viewed, bought together, buy after viewing)
- salesRank - sales rank information
- brand - brand name
- categories - list of categories the product belongs to.
Building the Graph
Using the data described above we build a graph where each node is a product and each edge is a relation between two products. Each node in the graph has a weight that will be used to compute the graph edge weight.
Product score
We use the first dataset to compute this score. For a target product, we get all the reviews for that product and for each review we extract the helpfulness vote and the overall score. The thought process is as follow: the higher the overall score the better is the product. Also the higher the helpfulness the more people considered this review when buying this product. So we need to build a product score that is directly proportionate to the overall score and the helpfulness vote. Two models came up:
- Multiplicative model: score = helpfulness * overall
- Additive model: score = alpha* helpfulness + (1-alpha) * overall
We consider both models for evaluation to see which one performs better.
Graph edges
Using the second dataset we create the edges between the products. Using the co-purchased links, we build edges between the target product and each co-purchased product as follow:
- Edge with weight=1 for bought_together products
- Edge with weight=2 for also_bought products
- Edge with weight=3 for also_viewed products
After creating the initial edge weights, we compute new weights based on the product score of each node and the initial edge weight. The new score of an edge E between product P1 and product P2 is as follow:
E(P1, P2) = Initial edge weight * (1 - product score P1) * (1 - product score P2)
This way, products with higher product score and better initial interaction are closer in the graph.
This way, we built a graph of 1.5 million nodes and 52 million edges.
Search for K-nearest products
To find recommendations for each target product, we search for the k nearest products and return them to the user.
- Start by adding all direct connections of product A to candidates list
- For each item in candidates list:
- add it if candidates list has no K items
- Else add it only if distance to product A is smaller then the max distance of all products in the list
- Sort candidates
- Return K first ones as recommendation
Evaluation
This is where we got stuck at first and did not know how to evaluate our models. This is not a case where we train a model and test it on subset data. After researching, we found that recommendation systems are usually tested with A/B tests in industry, where a business related metric (e.g Total sales) is tracked on a statistically representative sample of users. We decided to do a mini version of that. We chose 10 products randomly and considered the recommendations of these 4 models:
- Multiplicative model
- Additive model with alpha=0.25
- Additive model with alpha=0.5
- Additive model with alpha=0.75
- Amazon recommendation from Amazon.com as a baseline for comparison.
We gave these recommendations to 5 participants and asked them to report for each target product which items are relevant as a recommendation. From there we where able to compute a relevancy score as the ratio of total relevant recommendations from the total samples.
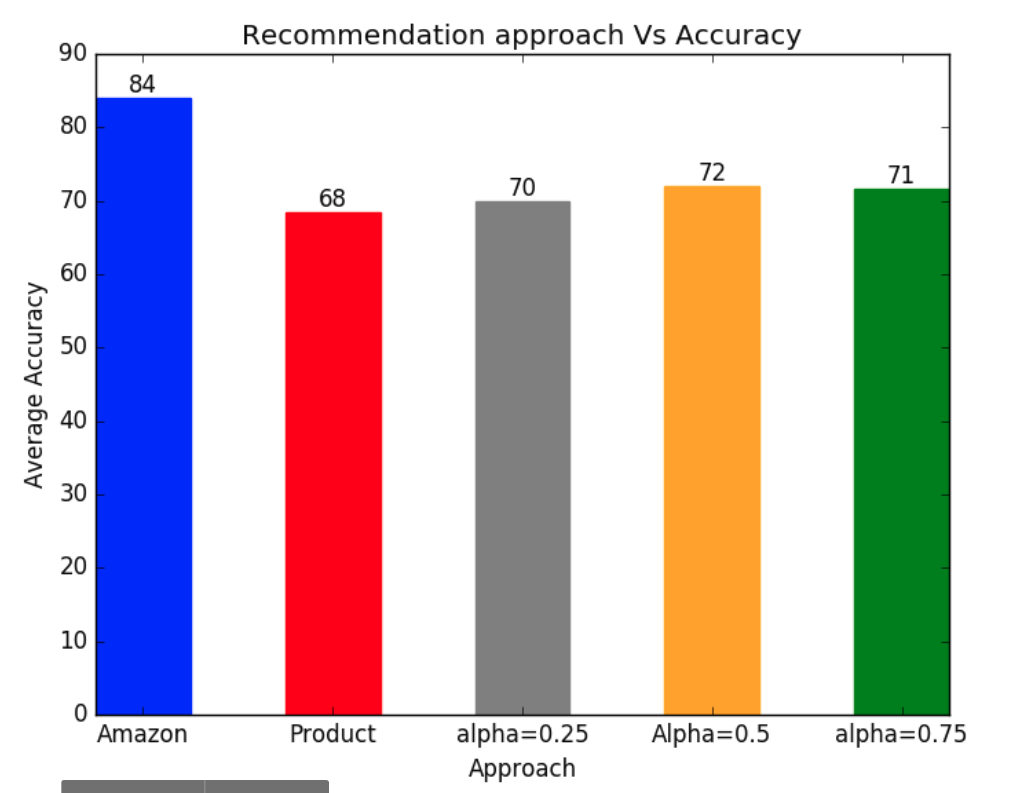
Relevancy scores
As expected, Amazon recommendations are the most relevant (otherwise we would be billionaires). For our models, additive models performed better than multiplicative ones. After some investigation, we found out that a lot of the reviews have a helpfulness score of 0 and therefore the product score will be 0 no matter what the overall score is.
As for the additive models, we found that attributing the same weight to product overall score and helpfulness gave slightly better results than the case where one of the parameter is dominant.
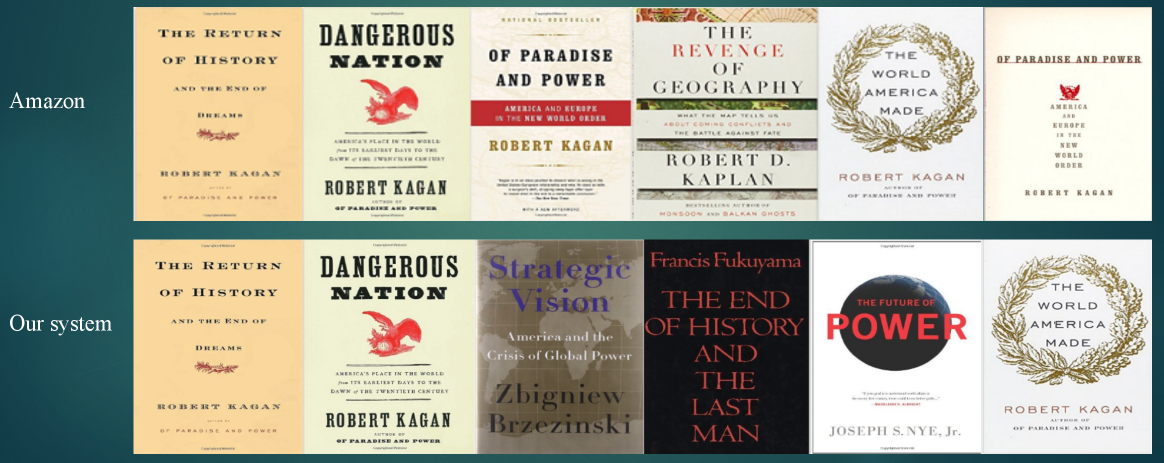
Recommendation example
Case Study
From the 10 products that we used for evaluation, we had one case where our system made better recommendations than Amazon. The target product is a kids related product, our model gave 4 kids related products while Amazon gave 2 kids related products and 3 cellphones.
In another case, the target product is a music album by Michael Jackson. Amazon recommended other music albums from the same artist. Our system did recommend other music albums but they where from different artists.
Additionally, there was a case where our system failed to produce any recommendations. This was due to selecting a product with no edges to any other product and therefore the search cannot find any product to recommend.
Further improvement
Given more time to work on the project, we had a couple of ideas to further implement. One of them is to perform NLP on the review text to extract sentiment from each review. We would attribute a score to how positive or negative a review is. This would led us to compute a different product score function. We can further boost the product score by using the rank of the product in its category given in the metadata dataset.
Another possibility is to add a category feature to each product. And by introducing how categories are similar, we ensure that no product is left without edges connected to it as will create new edges between products of similar categories.
Evaluation wise, we can add more participants and more products to get better estimation of the relevancy of our products. This would be streamlined by creating an app that proposes recommendations for users to select from.
The advantage of this approach is that the graph needs to be built only once. After that, it’s very easy to add products to it by just adding the node and edges to other products. Also the search algorithm is the online feature and is fast in returning recommendations.