Metflix: How to recommend movies - Part 0
In this series of posts, I will try to build a recommendation engine to recommend similar movies to a selected title or recommend movies to a user that rates a couple of movies. This part 0 will be about how to get the data, load it and do some basic Exploratory Data Analysis (EDA). We will finish this post by creating a user-item interaction matrix that represents the ratings given by a particular user to a particular movie. In the next post, I will post how to implement:
- User Based Collaborative Filtering (UBCF)
- Item Based Collaborative filtering (IBCF)
- Alternating Least Squares (ALS) method for Matrix Factorization (MF)
As for future posts, my intentions are to take the simple model that we build all the way to deployment by running it as a web service. I don’t know how to do that yet and that’s why I’m creating this series of post to document the journey.
The data
The data for this project is the MovieLens dataset. There two datasets that needs to be downloaded:
ml-latest-smallthis data has 100.000 ratings and 1.300 tag applications applied to 9000 movies by 700 users. We will use this data for initial prototyping to go fast.ml-latestthis data has 26.000.000 ratings and 750.000 tag applications to 45.000 movies by 270.000 users. This is much bigger data that we will use for final model deployment.
Load MovieLens data
The links to download both datasets are presented here
complete_dataset_url = 'http://files.grouplens.org/datasets/movielens/ml-latest.zip'
small_dataset_url = 'http://files.grouplens.org/datasets/movielens/ml-latest-small.zip'
import numpy as np
import pandas as pd
import matplotlib.pyplot as plt

import scipy.sparse as sparse

%matplotlib inline
Let’s start with the ratings data
ratings = pd.read_csv("data/ml-latest-small/ratings.csv")
ratings.head()
| userId | movieId | rating | timestamp | |
|---|---|---|---|---|
| 0 | 1 | 31 | 2.5 | 1260759144 |
| 1 | 1 | 1029 | 3.0 | 1260759179 |
| 2 | 1 | 1061 | 3.0 | 1260759182 |
| 3 | 1 | 1129 | 2.0 | 1260759185 |
| 4 | 1 | 1172 | 4.0 | 1260759205 |
ratings.userId.nunique(), ratings.movieId.nunique()
(671, 9066)
We have 671 unique users and 9066 unique items. Let’s see how many movies each user have rated.
But first let’s disregard the time-stamp as it’s not needed for this context. Time information can be helpful to us if we want to split the ratings data and make learning iterative by updating the ratings with time. This might be a good feature to add to a deployed model for example, by adding new incoming ratings daily or weekly or monthly and retraining the entire model.
ratings = ratings[["userId", "movieId", "rating"]]
data = ratings.groupby("userId", as_index=False).agg({"movieId": 'count'})
data.head()
| userId | movieId | |
|---|---|---|
| 0 | 1 | 20 |
| 1 | 2 | 76 |
| 2 | 3 | 51 |
| 3 | 4 | 204 |
| 4 | 5 | 100 |
data.movieId.hist()
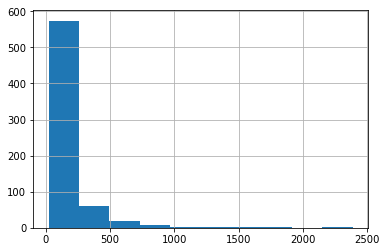
Histogram of number of items rated by users
data.movieId.describe()
count     671.000000
mean      149.037258
std       231.226948
min        20.000000
25%        37.000000
50%        71.000000
75%       161.000000
max      2391.000000
Name: movieId, dtype: float64
On average, users rated 149 movies. Interestingly, all users have rated at least 20 movies. This is useful when making the train and test data to evaluate our models.
Let’s load the movies data
movies = pd.read_csv("data/ml-latest-small/movies.csv")
movies.head()
| movieId | title | genres | |
|---|---|---|---|
| 0 | 1 | Toy Story (1995) | Adventure|Animation|Children|Comedy|Fantasy |
| 1 | 2 | Jumanji (1995) | Adventure|Children|Fantasy |
| 2 | 3 | Grumpier Old Men (1995) | Comedy|Romance |
| 3 | 4 | Waiting to Exhale (1995) | Comedy|Drama|Romance |
| 4 | 5 | Father of the Bride Part II (1995) | Comedy |
This data will be helpful to match movieId with the movie title
Now, let’s make a user item interaction matrix. A user item interaction matrix is where each user is represented by a vector of length the number of unique items. From our ratings data, we convert each row into the specific user and item interaction and 0 everywhere else. This will result in a big matrix with a lot of zeros therefore we need to use sparse matrices to save memory. Keep in mind that the final data will have 45.000 movies and 270.000 users.
users = list(np.sort(ratings.userId.unique())) # Get our unique customers
movies = list(ratings.movieId.unique()) # Get our unique products that were purchased
rating = list(ratings.rating) # All of our purchases

rows = ratings.userId.astype('category', categories = users).cat.codes
# Get the associated row indices
cols = ratings.movieId.astype('category', categories = movies).cat.codes
# Get the associated column indices
user_item = sparse.csr_matrix((rating, (rows, cols)), shape=(len(users), len(movies)))
matrix_size = user_item.shape[0]*user_item.shape[1] # Number of possible interactions in the matrix
num_purchases = len(user_item.nonzero()[0]) # Number of items interacted with
sparsity = 100*(1 - (1.0*num_purchases/matrix_size))
sparsity
98.35608583913366
user_item
<671x9066 sparse matrix of type '<type 'numpy.float64'>'
	with 100004 stored elements in Compressed Sparse Row format>
The user item matrix has 671 unique users and 9066 unique movies which checks with what we found earlier in our data exploration. This matrix is 98.35% sparse which seems too low but it should be usable for the algorithms that we will use.
I will stop here for this post. Next post will be dedicated to the different algorithms that we will test. We will see UBCF, IBCF, ALS for Matrix Factorization and decide on an evaluation metric. All the code for this project is available on my Github